June 22, 2017
The sport of show jumping has evolved dramatically in the last 20 years.
Some notable changes include:
- An increase in the number of FEI ranking classes offered worldwide
- More ‘high-quality’ competition venues with increased prize money
- More technically demanding course, with tighter times and rails that will fall from the cups more easily
As a sport changes, it is pertinent to look for trends over time that provide insight into its current state and will point to what the future of the sport will look like. To be sure, the riders who consistently excel over time in this sport are those who continue to evolve with the changing demands of the sport, often predicting changes before they occur.
For the purposes of this article, we’ll look at relevant competition data obtained from the top show jumping horses over the past five years. Data was obtained from the top 20 show jumping horses as determined from the ‘Combination in Jumping’ FEI Ranking List for each year from 2012 to 2016. The competition history for each horse was analyzed for the respective calendar year and the results are presented below. All data reported are mean ± standard deviation. This data demonstrates what the top horses are currently doing in competition, and how their riders schedule competitions to ensure top results.
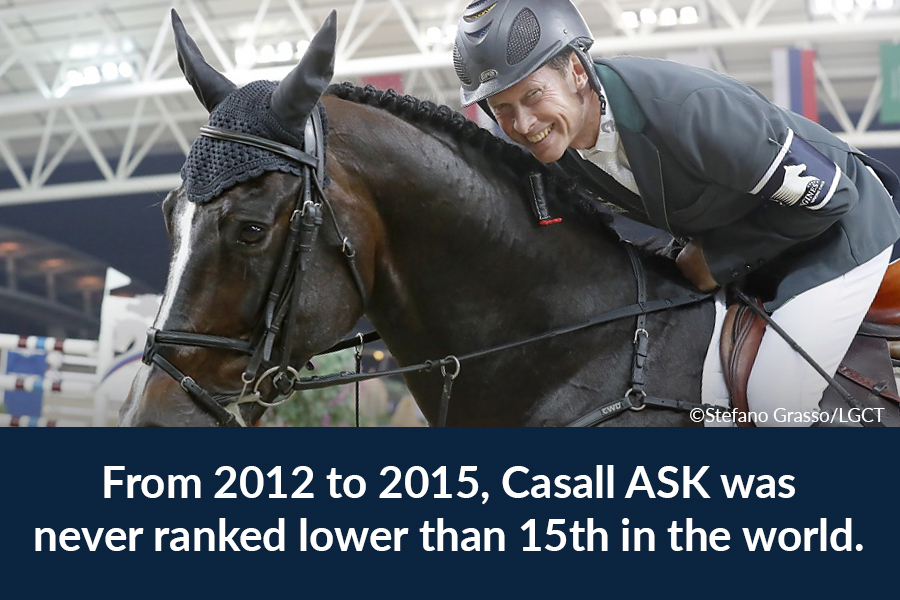
Before I get into the numbers, I would first like to acknowledge the incredible career of Rolf-Göran Bengtsson’s stallion Casall ASK. From 2012 to 2015 Casall ASK was never ranked lower than 15th in the world, which is a remarkable testament to his consistency and durability. The next closest horses were only able to break into the Top 20 in three out of the five years analyzed—again, highlighting Casall ASK’s dominance in the sport.
Horse characteristics
Whenever I do an analysis, there are a few general metrics that I always look at. These simple descriptive metrics are helpful as they provide information regarding the characteristics of elite show jumping horses. Each of these metrics are typically quite consistent from year to year in the show jumping sport. A sudden divergence from the “norm” in one of these areas would demonstrate a major change in the types of horses that were rising to the top of the sport.
Sex
Firstly, I examined the breakdown of sex for elite jumping horses over this five year period. Generally the proportion of geldings in elite show jumping has remained constant over the past five years (see below). Conversely, the number of stallions and mares has fluctuated from year to year. However, this information is probably due to the small number of horses examined each year (20 per year), and not a reflection of a shift of riders to favor mares over stallions. When looking at the Top 100 horses from 2015, a similar trend was apparent, with 44% geldings, 29% stallions and 27% mares.

Age
The average age of the Top 20 horses was 11.8±1.8 years. From my previous work examining the Top 100 horses in both 2014 and 2015 (data not shown), 11.8 was the approximate age of these horses as well. This indicates that horses are in the midst of the peak of their competitive careers around the ages of 10–13 years old.
Of course, with proper management, top results are possible for many more years past this age range, with numerous horses still competing at a high level at 18 years of age (e.g. Casall ASK). Interestingly, the age of horses on these top lists does appear to be linked to the sex of the horse. Specifically, stallions are, on average, older than geldings and mares. Data from the Top 20 horses combined for all five years are shown below, but the trend also holds for the Top 100 horses on the list as well as for horses that competed at the 2012 and 2016 Olympic Games (data not shown).

Color
This statistic is not groundbreaking information, but it is fun to look at nonetheless. In elite jumping horses, bay horses are significantly more common than greys and chestnuts. Besides indicating the most common colors for show jumping bloodlines, there is not much other useful information that can be gained from this metric.

Competition Scheduling
Once the general descriptive information on elite horses was analyzed, I examined the competition trends in more detail. For this phase, I was looking for specific data that indicate the current competition tendencies of top show jumping horses, and where the sport may be heading in the future.
Competition locations
One of the most difficult decisions to make when planning a competition schedule is choosing where and when to compete. As the sport has expanded globally, there are more competition options than ever before.
To begin, I looked at the number of different competition venues top jumping horses were attending, as this provides an approximation of how much travel these horses are doing. The number of different competition locations for the Top 20 jumping horses are shown below from 2012 to 2016.
The maximum number of different locations was 24 unique venues for one horse in a single year, while the minimum was six unique locations for a few horses. North American horses tend to attend fewer different venues as compared to European horses, as they spend extended periods of time at venues like Spruce Meadows (Calgary, AB) and the Winter Equestrian Festival (Wellington, FL). Besides a slight dip in the number of venues in 2013, top jumping horses have remained relatively constant on how many different competition venues they attend in a year.

Intercontinental travel
Another scheduling question that creates significant logistical and physiological issues for the horse is that of intercontinental travel. With the explosive growth of the sport, top horses now have the freedom to compete at numerous top venues around the world. However, how the top horses respond to this travel remains unclear.

Below, the average number of continents that top horses competed on from 2012 to 2016 are shown. Of course, some horses may only compete on one continent, while others will compete on four in a single year (e.g. Taloubet Z in 2012).

When analyzing further, it is also possible to determine where the top jumping horses are obtaining the bulk of their FEI points. The number of different venues on each continent where the top jumping horses obtained FEI points are demonstrated below. The figure clearly shows the dominance of the European circuit, where from 2012 to 2016, the world’s top horses attended 143 different venues in Europe, as opposed to the next closest of 31 different venues (North America).

Number of FEI starts
Another important metric to analyze is the number of starts in FEI competition. There is some debate amongst top riders as to how much elite horses should compete. Although answering this question relies on a number of different factors, examining the competition history of other elite horses can allow a rider to make a better informed decision. If your horse is competing a lot more or a lot less frequently than most other elite jumping horses, then it may indicate an issue regarding your program.

These values only reflect classes that contribute to FEI points (i.e. national classes are not included in the number of starts). As demonstrated below, the average number of FEI rounds completed in a season is in the mid-thirties, but some horses will compete over 60 times a year in FEI classes. The minimum number of starts was 20: Cortes ‘C’ in 2014 and Nino Des Buissonets in 2013.
Championships
From 2012 to 2015, there were six championship competitions:
- 2012 London Olympics
- 2013 European Championships
- 2014 World Equestrian Games
- 2015 Pan American Games & European Championships
- 2016 Rio Olympics
It is interesting to evaluate how many of the world’s elite horses are competing in these championships. In some cases, one rider has multiple horses in the Top 20, which excludes some horses from being selected to teams. But there were other numerous situations where horses on the Top 20 list were left off teams, indicating that a high FEI ranking is not a guarantee for being selected for a championship team.

Going one step further, we can look at how competing in a major championship may affect competition scheduling. In human sports, we tend to see a slight reduction in the number of competitions in the year of a major championship. Below, the same trend is apparent for elite horses that competed in a championship as opposed to those that did not. The number of weeks during the year that horses were competing are broken down into two groups: horses that performed in a major championships and those horses that did not.
From the graph below, it is clear that generally, if a horse is competing in a major championship it will perform fewer weeks during the year than those horses that are not performing in a major championship. From 2012 to 2016, the highest number of weeks competing was 28 weeks out of the year, while the lowest amount was 10 weeks.

Selection of competition point level
Another factor to consider when selecting competitions is what level to compete at. Generally, with an increasing FEI point level comes increasingly difficult competition (point levels are defined by the available prize money, shown below).
| Point Level | Prize Money (USD) |
| AA | $378 000+ |
| A | $215 700-$377 999 |
| B | $129 300- $215 699 |
| C | $86 000-$129 299 |
| D | $34 600-$85 999 |
Below, the percentage of competing at different point levels for elite horses are shown. Two trends become apparent from this data:
- Even for elite jumping horses, the highest percentage of classes are at the D point level range.
- In the past five years, elite horses have been trending to competing more frequently in AA point level classes. For the future, this trend is likely to continue, with more riders saving their top horses for big classes at the AA point level.

Competition Outcomes
Time Allowed
The one metric that does not get enough attention is the duration of jumping courses. The amount of time horses are required to perform their courses in provides great insight into the physiological demands of the sport, as the horse is required to produce approximately 14 to 17 jumping efforts in an average time period of 73±3.5 seconds. Below, the average time on course for the first round of competition is demonstrated. Note the consistency of the average time on course across the five years, indicating that this will likely remain constant for the sport moving into the future.

Based on this information, training should be focused on maximizing the horse’s potential to accomplish jumping efforts in a window of approximately 73 seconds. A training program that focuses on working the horse for extended periods of time (greater than 120 seconds consecutively) will likely not be benefiting the horse’s sport potential, and may actually be reducing the physiological capacity of the horse to compete at the elite show jumping level (reference: Bondarchuk AP, yessis M (2007) Transfer of Training in Sports. MI: Ultimate Athletic Concepts).
Top 16 placings
As this is an analysis using a ranking system based on FEI points, it would not be complete without examining the efficiency of the top horses to acquire FEI points. FEI points are allocated to the top 16 placings in each designated competition. Below, the percentage of total rounds where points were obtained by the top jumping horses is demonstrated. This is truly a humbling statistic, as on average 35% of the time the world’s top horses compete, they are finishing outside of the top 16 spots in a class.

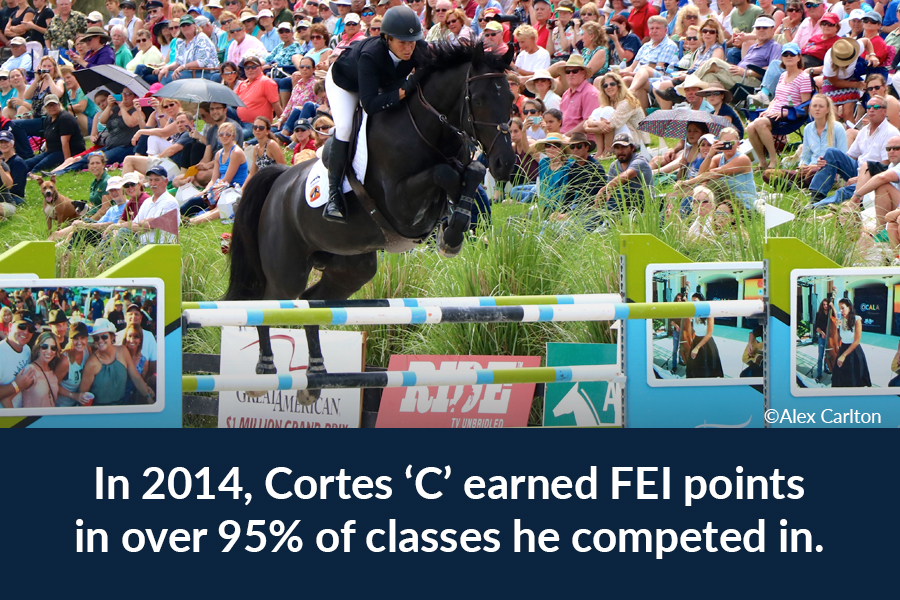
It is also interesting to note that two horses (Cortes ‘C’ in 2014 and H&M All In during 2016) obtained FEI points in over 95% of classes they competed in—a very impressive feat.
Clear round percentage
It is also interesting to evaluate the ability of the world’s best horses to consistently put in clear rounds. Below, the percentage of clear rounds at the AA, A and B point level are shown. On average, the best horses in the world jump clear rounds less than 50% of the time. Furthermore, there is a slight trend to an increasing number of clear rounds in the last five years.

This likely highlights a future trend for the sport, where courses will either be made more challenging to bring the percentage of clear rounds back down, or more horses will make it to the exciting jump-off round. As an aside, in 2013 Big Star had an incredible year, jumping 12 competitions at this level and going clear over 90% of the time.
It is interesting to look at the percentage of rounds clean at each point level (see below). Here it becomes apparent that the percentage of clear rounds at different point levels is relatively constant across the years. The one exception is the C point level competitions, where the percentage of clear rounds was below 40% in 2013, but then well above 60% in 2016. This indicates that for top horses, competing at the C point level is the least predictable situation (or at the very least, was the least predictable over the last five years).

Take-home points
- The average elite horse is 11.8±1.8 years old
- North American based horses attend fewer different competition venues than European horses
- Horses competing in a major championship will compete less that year than horses not in a major championship
- The average time on course in the first round is 73.8±3.5 seconds
- Clear rounds are becoming slightly more common from elite jumping horses
About the Author

Dr. Tim Worden has worked as a sport scientist with numerous FEI-level show jumping riders. He has a PhD in biomechanics and specializes in applying human high-performance training techniques to horses.